Optimizing Recruiting Plan 2: Multi-year planning under uncertainty

Introduction
In the previous article, I explored a simple linear programming problem to decide the headcount for a new consulting organization. In this article, I will expand the model into a bit more realistic one i.e., people transition and recruiting a multi-year span. The model will output the recommended number of recruits at each semester and the maximized revenue amount earned from the grown organization.
Model Formulation
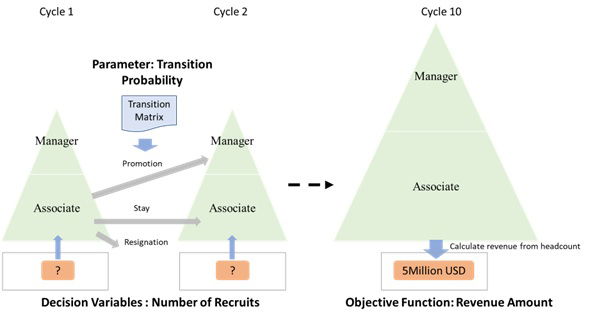
Before I define mathematical formulation, let me describe what I intend to do in the Linear Programming model. Figure 1 shows the relationship of variables in the model. First, we define a pyramid structure at each planning cycle. This is to count the number of headcounts by job title. Headcount is sum of transition from the previous cycle and external recruits.
For example, Associate at cycle 2 is coming from (1) an existing Associate at cycle 1, and (2) New Associate hired from external. The first group will be less or equal to the previous cycle because some members have already been promoted or dropped.
How many members will stay in cycle 2? Here, the Transition Probability comes into the picture. In the model, the headcount of existing members are decreased by applying transition matrixes. Associate at cycle 2 will be a headcount at cycle 1 multiplied by the transition probability.
The second group is nothing but a driver of future growth. Number of recruits at each cycle is defined as a decision variable. In the above way, we can calculate headcount until cycle 10, i.e., 5 years after.
The next step is to define Objective Function. You can convert headcount data into revenue amount by multiplying headcount and billing rate.
Figure 1. Formulation of Linear Programming
Demo: Two-year headcount planning
Here, let’s take an example to walk you through the optimization procedure.
Scenario
You are running a small consulting group which consists of 6 Associates and 2 Managers. You need to create a recruiting plan for the next two years. How many people should be hired to maximize revenue in two years?
Problem Formulation
To solve this through Linear Programming, we need to define three elements in a System of Linear Equations.
1. Decision Variables
xc: Number of recruits for Associate at cycle c
yc: Number of recruits for Manager at cycle c
2. Objective function
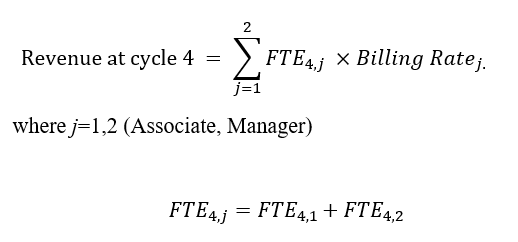 FTE4,1 is the headcount of Associate at cycle 4. This is the sum of Associates from cycle 3 and new recruits. Hence,

Associates from cycle 3 is calculated by applying the probability to stay (TP1,1 ) and headcount at cycle 3.
FTE4,2 is the headcount of Manager at cycle 4. This is the sum of staying Manager from cycle 3, promoted Associates and new recruits. Hence,

In a similar manner, FTE count is calculated backwards up to cycle 1. You will notice that FTE3,1 can be expressed using FTE2,1 and x3,1. If you trace back the calculation, you will come to know that FTE4,1 is a function of internal transition from existing headcount and additional recruits at each cycle.
3. Constraint
You can assume the same constraint as the previous article.
xc <=5
yc <=4
FTEc,1 /FTEc,2 >= 2
Solution
Let’s implement the above LP formulation. In this article, I will demonstrate it using Excel Solver add-in. Solver is an excel add-in program to perform an optimization. You can add decision variables, constraints, and an objective function in the same excel worksheet. Figure 2 shows the example of input and output.
Figure 2. Solver input and output example
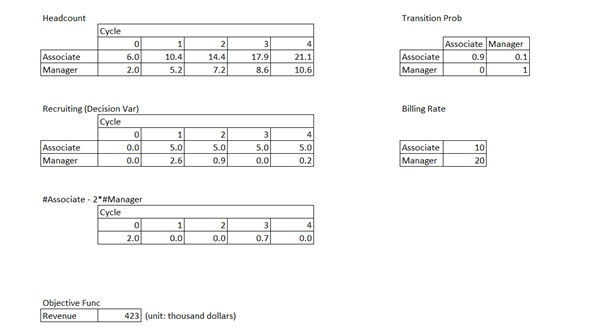
In the ‘Headcount’ table, the initial headcount at cycle 0 is defined as 6 and 2 for Associate and Manager. The numbers from cycle 1 to 4 are the forecasted headcount. Internal transitions i.e., promotion and resignation are based on the ‘Transition Prob’ table in the right side. For example, number of Associate at cycle 1 (D5 cell) is calculated as shown in Figure 3. In the case of Manager headcount, you need to consider new Managers who were promoted from Associate as well as keeping existing Managers and adding external recruits. (See Figure 4)
Figure 3. Formula for headcount of Associate at cycle 1
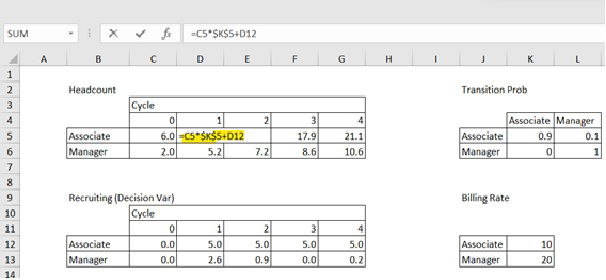
Figure 4. Formula for headcount of Manager at cycle 1
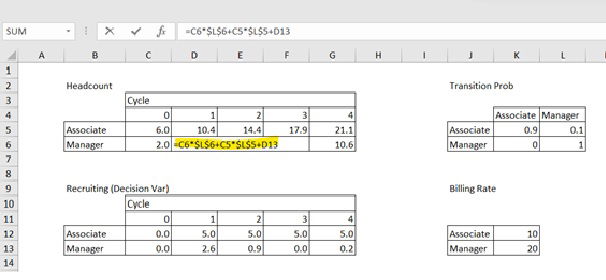
Once you calculate headcount until cycle 4, you will proceed with an objective function. In the table ‘Objective Func’ in Figure 5, revenue amount is defined as the multiplication of headcount and Billing Rate. This revenue is the revenue amount per month at cycle 4.
Figure 5. Formula for objective function
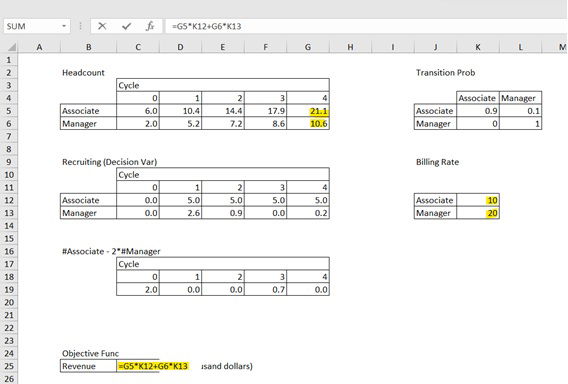
Now, it is time to configure the linear programming problem into Excel Solver. Navigate to ‘Data’-‘Analyze’-‘Solver’. All the parameters are shown in Figure 6.
Figure 6. Solver Parameters
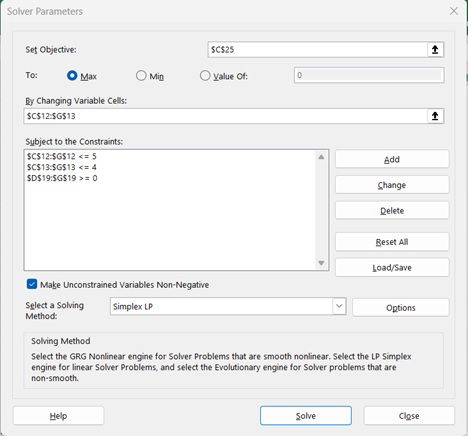
- Set the value of objective function in ‘Set Objective’
- Choose ‘Max’
- Set the range of decision variables in ‘By Changing Variable Cells’
- Add constraints in ‘Subject to the Constraints’
- The first two constraints are maximum number of recruits at each title and cycle.
- The third is the minimum ratio of Associate-Manager headcount. The range ‘$D$19:$G$19’ is calculated as ‘Number of Associate – 2 * Number of Manager’. I am restricting this value to be more than 0. This means that the ratio of Associate to Manager should be more than 2.

- Choose ‘Simplex LP’ in ‘Select a Solving Method’ which means Linear Programming is used for the optimization algorithm
- Push ‘Solve’ button
If all the information is set correctly, the value 423 will be given as the Objective Function return. Also, you can see how many Associates and Managers should be recruited in the decision variable table.


Conclusion
Through looking into the simple output in the latest two articles, it would be great if you might have noticed that workforce data will add value in making a strategic decision. The benefit of the linear programming model is to allow you to simulate the impact of investment for recruiting or retention programs. The key is to collect and store multiple workforce data e.g., employee transitions, billing rate, and so on.