Optimizing Recruiting Plan 1: Beyond spreadsheet

Introduction
In the previous article, I explored techniques to forecast future headcount using estimated transition probabilities by job title and tenure. Assuming that there is no additional recruitment from external, your team will be likely to reduce the size because of high turnover rate.
Here, recruiting plan comes in. Proper recruiting plan will make sure to supplement talent base to keep your organization up to speed. But, how to do this? You might begin with creating a spreadsheet. It is usually to enter future plan of headcount, and then put the current headcount. Next, you will fill the gap between plan and current by adding goal of recruits.
However, the excel work becomes difficult to track people dynamism by service line for multiple years. In my opinion, software application is necessary. In this article, I will explore simple optimization technique to figure out recruiting plan to grow professional service organizations. I will begin with the simplest case where you launch new organization and decide number of recruits.
Modeling service revenue on headcount information
As I discussed in the first article, headcount is highly tied to revenue in a professional service business. The main idea to optimize recruiting plan is to figure out the best size of headcount that maximize financial outcome. The idea is that number of headcounts is a driver of sales revenue in a professional service firm. Therefore, revenue amount can be defined as a function of its talent assets.
[Function of financial outcome]
Revenue Amount = Billing Rate * Utilization * Number of headcounts
[Driver]
Billing rate
Utilization
Number of headcounts
The higher the billing rate and utilization are, the more revenue you earn from your client. Number of headcounts can be function of several variables such as Promotion rate, Retention rate and number of recruits. In general, highly retaining organization won’t require much recruiting. The higher the Retention Rate is, the less number of recruits is required.
Now, we come up with element of modeling service revenue. In the next section, I will explore a traditional technique called Linear Programming to implement the model.
What is Linear Programming?
Linear Programming (LP) is one of the techniques in the field of Decision Science. It aims to find optimum solutions that maximize or minimize a quantitative business goal under multiple constraints. Linear Programming is the most foundational method to optimize decisions by framing real- world problems as simultaneous equations. To understand the concept, let’s take a very simple scenario.
[Scenario]
You want to start a new consulting firm which consists of two job titles: Associate and Manager. Given market research, it is confident that Associate can be billing $10,000 and Manager $20,000 per month with 100 percent utilization. How many people should be hired to maximize revenue per month?
Since there is only one recruiter in your firm, you can recruit up to 5 people for Associate and 4 people for Manager. Also, you need to keep proper balance between the two titles. 1 Manager needs to have at least 2 Associate in your organization.
[Problem Formulation]
To solve this through Linear Programming, we need to define three elements in a System of Linear Equations.
1. Decision Variables
x: Number of recruits for Associate
y: Number of recruits for Manager
2. Objective function
10x+20y=z
Objective function is a linear function of decision variables. In this example, we can formulate revenue amount.
z: Revenue Amount per month (unit: thousand dollars)
3. Constraint
x <= 5
y <= 4
x/y >= 2
Maximum number of recruits and minimum number of Associatet per Manager is defined as Constraints.
The Linear Programming model will find solution of x and y that maximize value of Objective function, i.e., Revenue Amount per month.
How can we solve this? We can solve this graphically using a powerful graphical calculator called Desmos. Desmos is provided by Desmos Studio. It is designed for math teachers to teach math concepts in a graphical manner. Using Desmos, you can define simultaneous equations on a x-y coordinate plane.
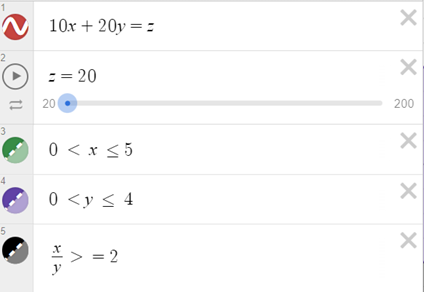
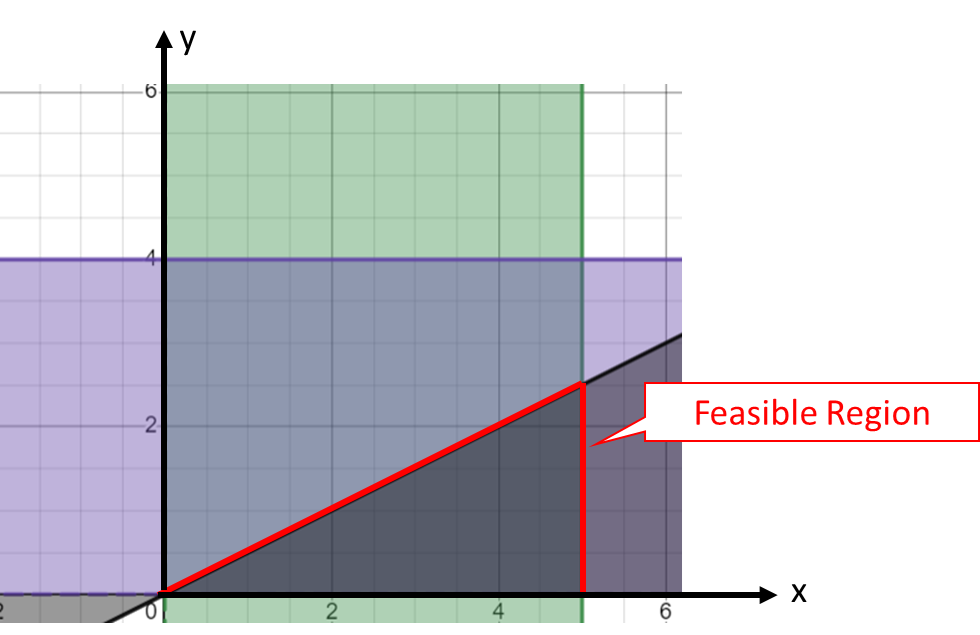
As shown in Figure 1, first you need to write Objective Function '10x + 20y = z'. Variable z is defined as dynamic parameter. Next, let’s define three constraints. Once three constraints are defined, it is plotted in x-y coordinate as well. For example, the green region in Figure 2 represents allowable number of recruits for Associate. Similarly, purple region represents allowable number of recruits for Manager. The third constraint x/y >= 2 is represented as black region.
Figure 1. Objective function and constraint setting

Figure 2. Feasible Region

So what? This means that an optimal solution should be found in the intersection of the three regions. This common region is called Feasible Region.
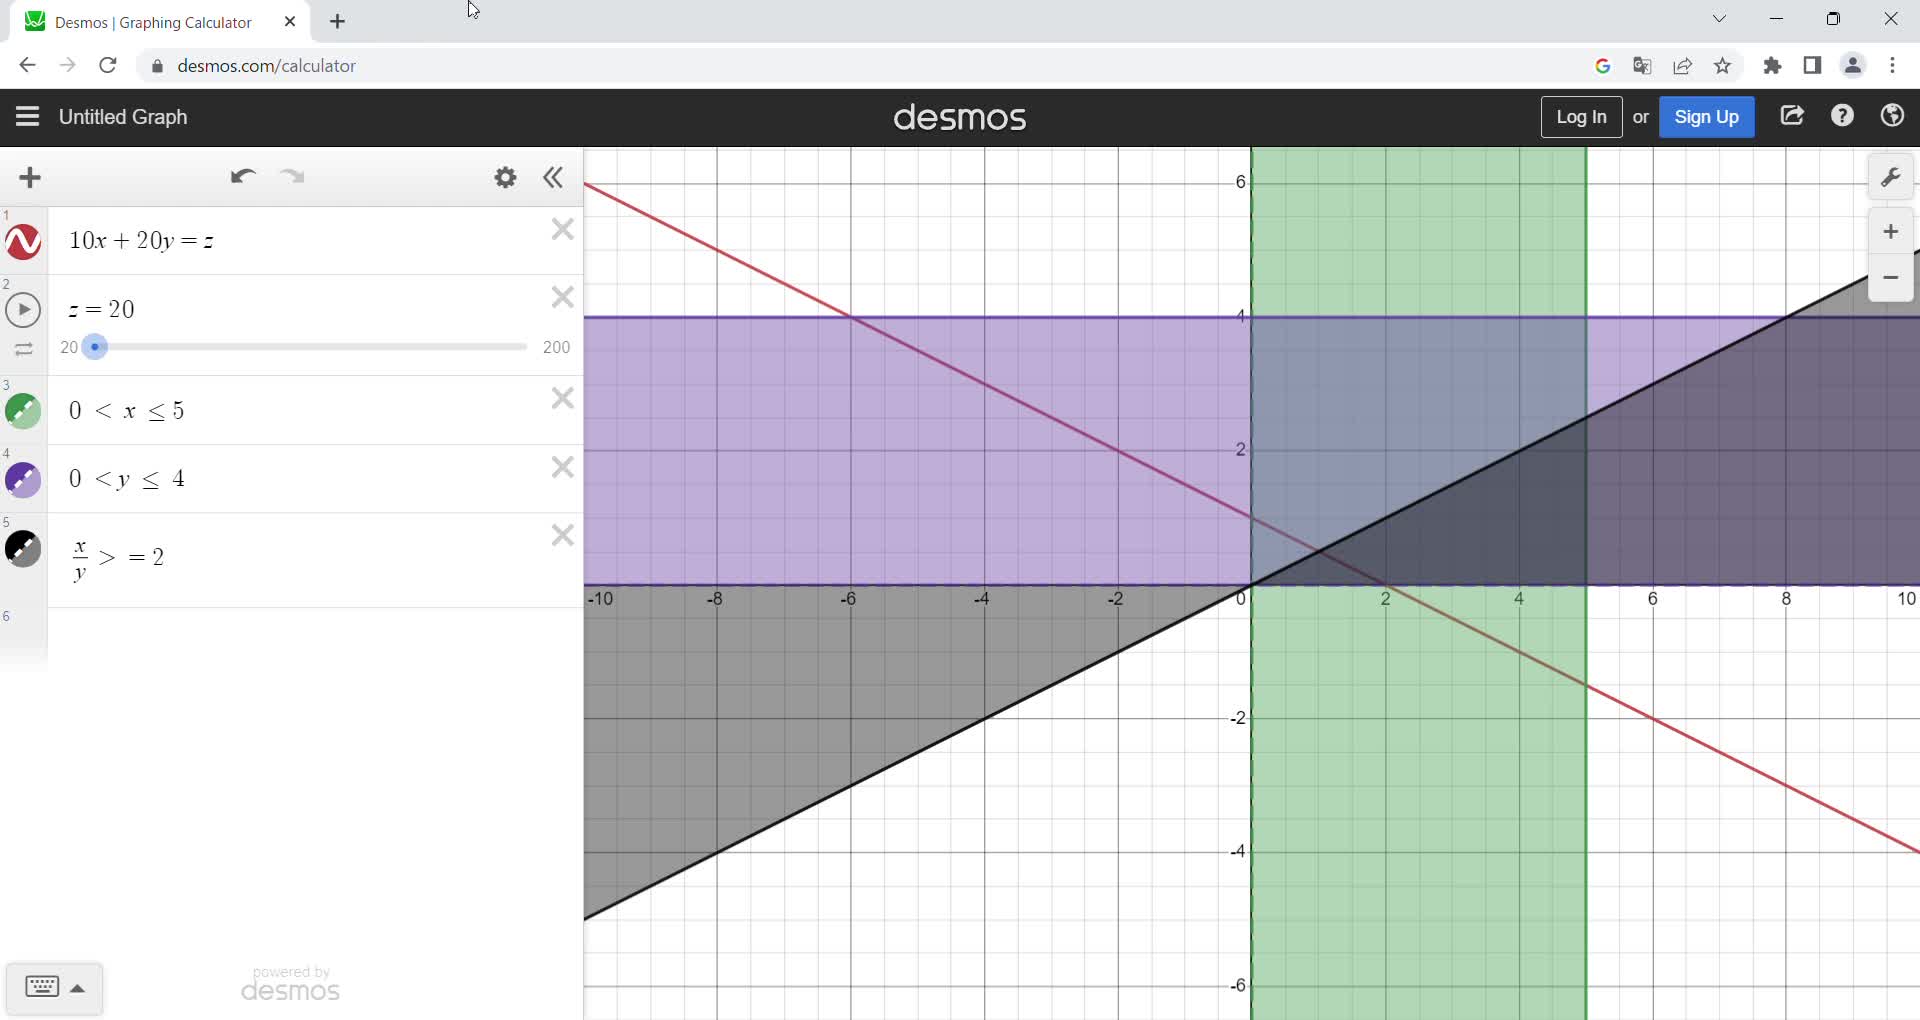
Now, it is time to solve the equation. In Desmos calculator, you can move z value using slider. This will move result of Objective Function here and there. The point is that the bar (equation) should always have overlap with Feasible Region. Another point is that you need to find the highest z value through sliding the bar. In Figure 3, the bar pinpoints optimal solution (x=5, y=2.5) in which z value is the highest 100. If you move the bar a bit higher, the z value will be increased. However, the bar goes beyond Feasible Region which means infeasible solution.
Figure 3. Optimal solution
Conclusion
Business decisions are made considering multiple possibilities and constraints. Possibilities are something that you can control and makes impact to the results. Constraints are conditions of available resources or unbroken regulations. If the decision is really strategic and involves complex conditions, it is worth using more sophisticated method beyond spreadsheet.
In the next article, I will add headcount transition matrix into the LP model and expand the recruiting plan to multi-year planning horizon.
Resources
Desmos Graphic Calculator https://www.desmos.com/calculator
