Forecasting Headcount Supply

Two-sided forecasting – Demand and Supply
In a general workforce planning process, headcount forecasting is performed in two directions. (1) Demand Forecasting and (2) Supply Forecasting.
Headcount Demand forecasting is involving estimating revenue, the number of projects by geography, and service line for future years. The forecasted numbers are broken down into estimated headcounts to fulfill the work. Supply Forecasting, on the other hand, predicts the change of headcount over time given historical data about promotion and resignation.
Note that this series of article is not covering demand forecasting. Although Demand Forecasting is a critical process in workforce planning, this will be the future.
Importance of Systematic Headcount Supply Forecasting
From my experiences as a manager in consulting industry, consulting partners have a good sense of change in talent demand. This is because they are always challenged to sell enough projects and frequently face market demand through client interactions. For instance, they might easily answer how many projects of supply chain operations research projects will be next year.
On the other hand, they tend to be less clear on the current size of internal. There might be some reasons. One would be that leaders are so busy in day-to-day client services that they delegate analysis of internal workforce to HR team.
Another hypothetical reason would be that many leaders are biased for a short-term solution to supply workforce. They might be under pressure to recruit matured managers to start important project. But too much external placement of senior roles makes future work structure ‘top-heavy’. Junior members quickly climb to the same position and your organization will suffer from less young workers to execute projects at scale.
One more caution is that there may be ‘generation gap’ in terms of attractiveness of professional service industry. Despite relatively higher compensation, this industry is facing more competition to acquire younger talents. According to David Maister, the author of ‘Managing The Professional Service Firm’, professional firms enjoyed benefit from increasing population of twenty-five-to-thirty-four age group until 1985. However, the younger population continues to decline over the next twenty years. ‘The “oil shock” of the early 1970s was caused by only a 5 percent shrinkage in worldwide supply. Professional firms are facing a 25 percent shrinkage in their nonpartner labor force. There is going to be a huge people shortage, and its effects will be major’ (Maister, 1997).
Senior leaders might think it is easier to recruit many people than it really is. In their olde generation, the profession ‘Management Consultant’ was much more prestigious but, young generation is noticing maturity of the industry as there are more Ex-consultants in client organizations.
Here, there is an opportunity to setup systematic process to forecast headcount supply in your organization.
Systematic Headcount Supply Forecasting
Now, let’s look into a technical method to forecast future headcount. The idea is to simulate the career progressions of the existing headcount in software and take a look at the estimated number of head count. In the previous article, we explored how to calculate time-dependent transition matrixes. Now, we apply these matrixes to simulate career progression.
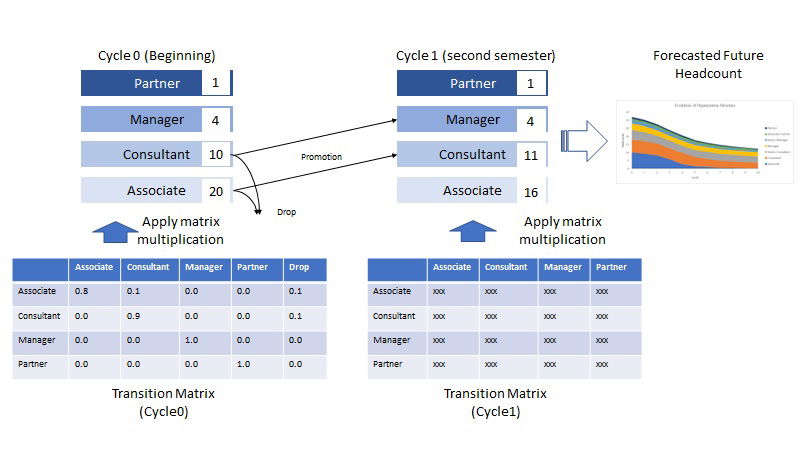
Figure 1. Headcount Supply Forecasting

The simple algorithm to estimate future headcount is present in Figure 1. The diagram illustrates a natural change in organization structure over multiple cycles. The word ‘cycle’ means the time period on which the decision for a promotion is made. We start with setting the initial headcount for each job title. In this example, 1, 4, 10, and 20 people are employed in each Partner, Manager, Consultant, and Associate. What will this team look like six months later?
The next step is to apply the transition matrix to those initial headcount. The matrix defines a probability to move from one title to another. In this example of Figure 1, 80 percent of Associate is likely to stay in the same title, 10 percent to promote to Consultant and 10 percent is likely to leave the firm.

Number of Associate at the beginning of cycle 1 is calculated as follows.
No of Associate at cycle 1 = 20 * 0.8 = 16
Number of Consultant at the beginning of cycle 1 is a bit complicated because there are two flows: Consultant staying from the previous cycle and New Consultant promoted from Associate. Hence,
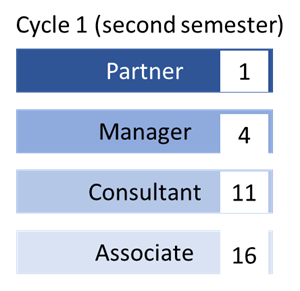
No of Consultant at cycle 1 = 10 * 0.9 + 20 * 0.1 = 11
Now, we obtain the forecasted headcount at cycle 1. We can repeat the same process to compute for cycle 2 by applying the transition matrix to the updated headcount. As we saw in the previous article, it is better to use another transition matrix only for cycle 1.
Figure 2. Forecasted Head Count at Cycle 1

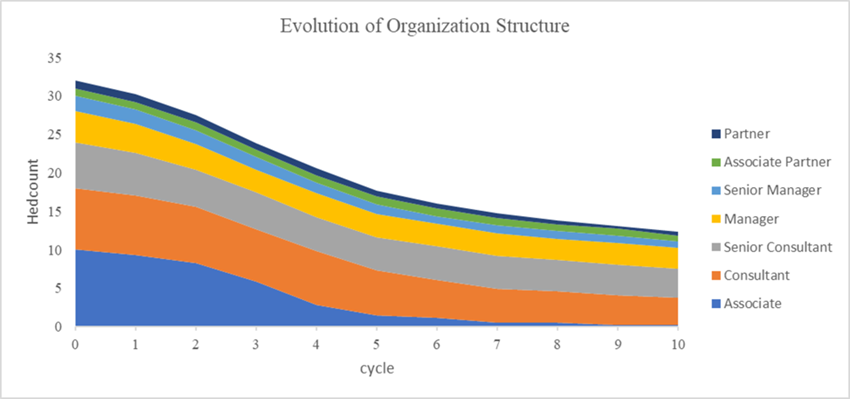
The simulation can be repeated over and over again for a more long-term future. Finally, you can reach the forecasted headcount at the final cycle for your planning horizon. The example of evolving organization structure for five years is visualized as a stacked area chart.
Figure 3. Example of decreasing headcount in an organization

In many professional firms, junior titles are more likely to leave the firms. This will cause a significant opportunity loss to execute projects at scale. As you can see in the above stacked chart, the decrease in Associate is not obvious until cycle 2 or 3. The curve drops from cycle 4. This is what the organization leaders are not aware without the systematic headcount supply forecast.
Conclusion
There is a two-sided forecasting: Demand and Supply. The visibility of the both will make sure to deploy right mix of different skillsets to maximize financial outcome. Especially, putting a systematic process to forecast headcount supply will save your organization from opportunity loss under coming staffing requests from your client.
Reference
Deloitte Consulting. (2018). Headcount modeling Optimisation tool. https://www2.deloitte.com/content/dam/Deloitte/kz/Documents/process-and-operations/KZ_headcount-modelling-en.pdf
Maister, D. (1997). Managing The Professional Service Firm. Free Press.