Clustering Analysis with Python to Discover Career Patterns

Four Life Stages of Butterflies: A Career Metaphor
The transformation of a butterfly is a striking reminder of the power of change and growth. Who would guess that the vibrant, eye-catching wings of a butterfly come from the humble beginnings of a larva? This metamorphosis, consisting of four distinct stages, reflects a remarkable journey.
First comes the egg, the origin of potential. Next, the larva emerges, focused solely on eating and growing. Once it matures, the larva transitions into the pupa, where the real magic happens: cells reorganize to form wings, legs, eyes, and other adult structures. Finally, the butterfly takes flight, a testament to the beauty of transformation.
This natural process offers profound lessons for career development:
Focus on one stage at a time. The larva doesn’t worry about flying.
Each stage prepares you for the next. What may seem like stillness in the pupa is, in fact, critical preparation.
Greatness often has humble beginnings. Every dazzling butterfly starts as a modest larva.
Introduction
In a previous article, I explored the career paths of Chief Data Officers (CDOs) by manually analyzing LinkedIn profiles within the UK job market. This analysis provided insights into how professionals evolve into leadership roles, helping organizations identify key skills and growth opportunities. Building on that foundation, this article uses data analytics to delve deeper into these career trajectories.
The research focuses on these key questions:
- How do professionals transition between roles on their journey to become CDOs?
- Are there discernible patterns in these career progressions?
Cluster Analysis: Mapping Unique Career Journeys
Every professional’s career is a story, shaped by personal decisions, values, and opportunities. As a recruiter, I’ve often been amazed with the rich narratives found in resumes and the unique ways people bring value to their roles. Yet, to effectively develop workforce strategies, it’s important to identify common patterns across these individual stories.
This is where Cluster Analysis shines. A cornerstone of unsupervised learning, Cluster Analysis doesn’t rely on predefined outcomes. Instead, it groups similar data points based on shared characteristics, uncovering underlying patterns. Unlike supervised techniques like regression, it excels at exploring the unknown.
Goal
The goal of this study is to identify three to five distinct clusters of CDOs based on their career backgrounds. In my initial manual review, I observed groups such as:
- Professionals with deep IT expertise.
- Individuals from quantitative fields like finance.
- Generalists
Using data-driven methods, this analysis aims to validate and refine these observations.
Data Preparation
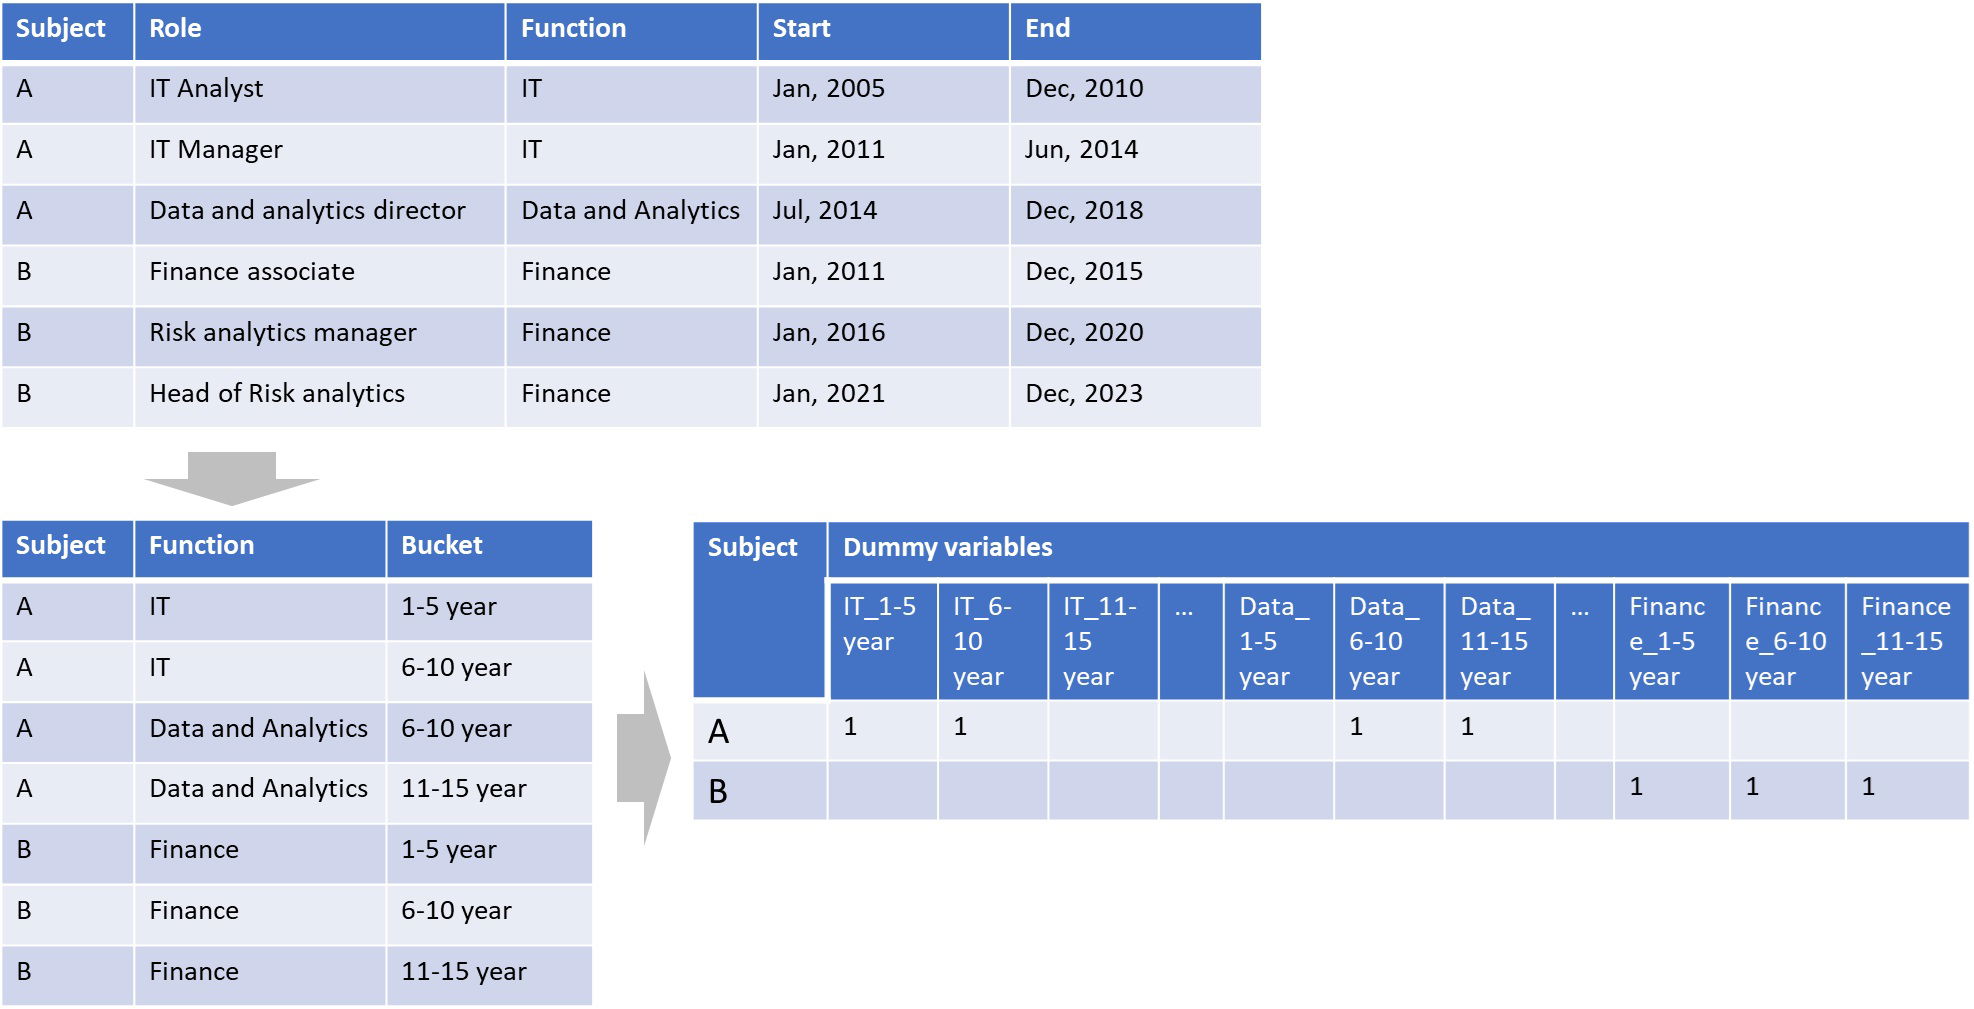
To analyze career transitions, I prepared a dataset capturing individual job histories, with a focus on functional roles and career stages. The data preparation process involved:
- Aggregating Job Functions: Standardizing job titles into broader functional categories.
- Segmenting Career Stages: Dividing assignments into five-year intervals.
- Creating a Numeric Matrix: Transforming categorical data into numerical values using dummy variables, essential for Cluster Analysis.
Figure 1. The transformation process, converting raw career data into a structured format suitable for analysis.
Running the Clustering Algorithm
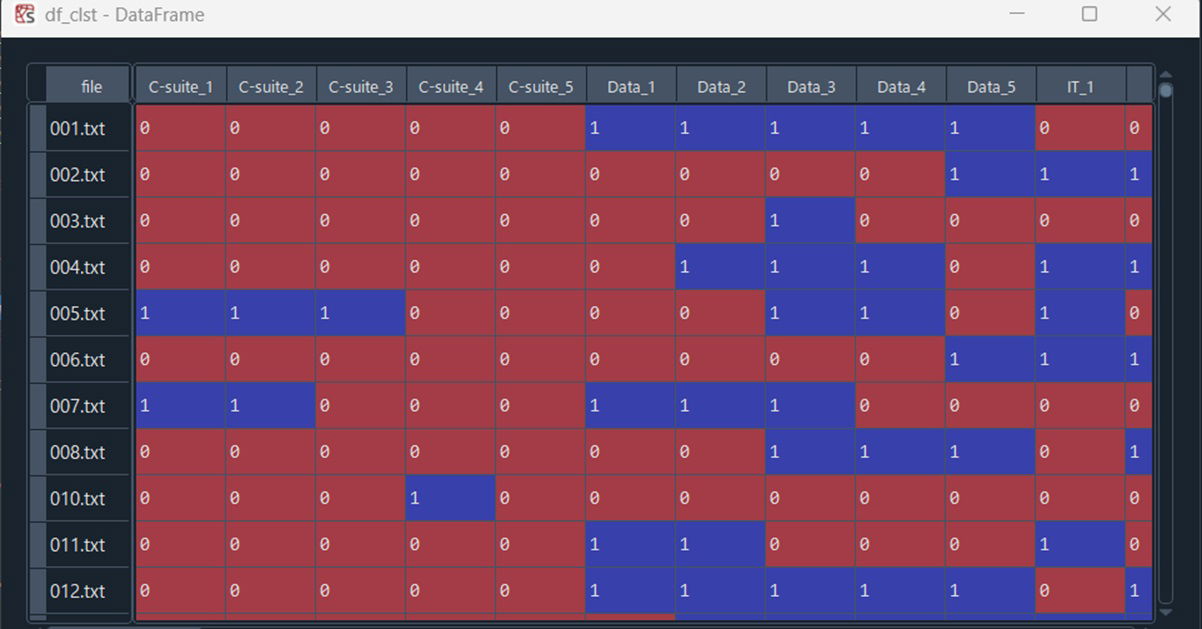
With the dataset ready, we applied the classic K-means algorithm for clustering. The Python code snippet below outlines the process:
from sklearn.cluster import KMeans
import pandas as pd

# Applying K-means
kmeans = KMeans(n_clusters=4)
kmeans_labels = kmeans.fit_predict(df_clst)
# Saving results to CSV
df_clst_label = pd.DataFrame({'file': df_clst.index, 'clst_id': kmeans_labels})
df_career_clst = pd.merge(df_career, df_clst_label, on="file")
df_career_clst.to_csv(out_dir + '/career_path_clusters.csv', index=False)
Figure 2. The input data structure, while the clustering algorithm groups similar career trajectories.
Findings
Initially, the algorithm grouped the data into four clusters. The distribution of professionals across these clusters is shown with descriptions summarized in Table 1.
Table 1. Cluster description (n_clusters = 4)

For example:
- Cluster 0: Professionals with consulting backgrounds (Table 2).
- Cluster 1: Experts primarily in Data and Analytics (Table 3).
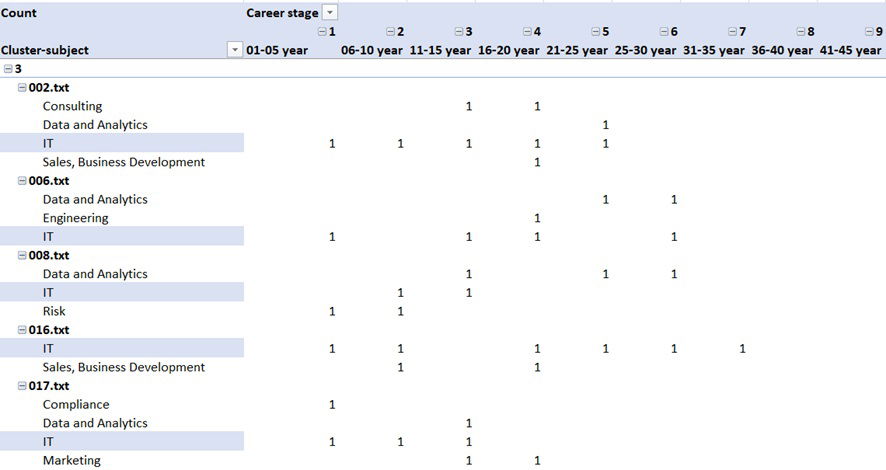
- Cluster 3: Those evolving from IT roles (Table 4).
Table 2. Examples of cluster 0 (From Consulting background)
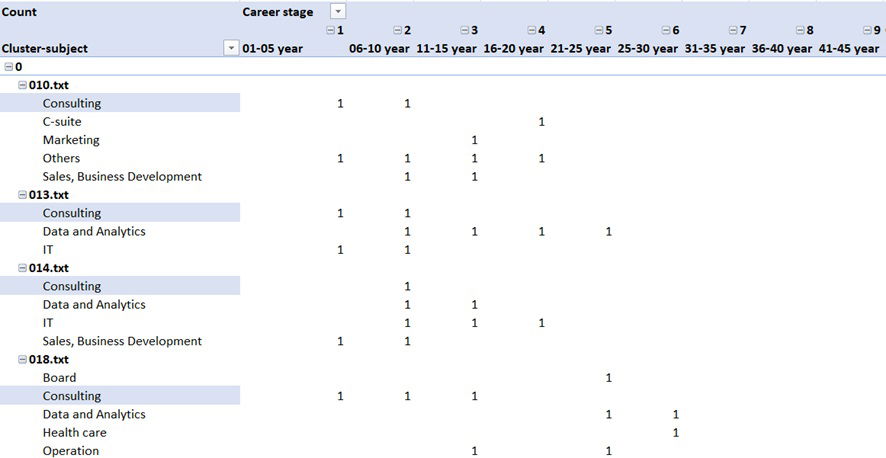
Table 3. Examples of cluster 1 (Data and Analytics role as primary background)
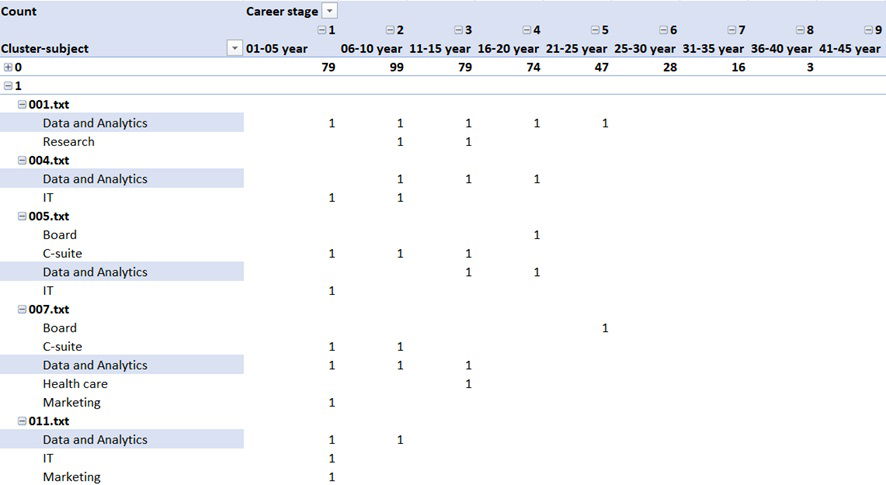
Table 4. Examples of cluster 3 (Evolution from IT role)
Exploring Cluster 2 revealed diverse backgrounds, including finance and marketing. It seemed that it was too much to attribute these to the characteristic of this cluster. To better capture these nuances, I increased the number of clusters to five. The result slightly went against my expectation.
Table 5. Detailed breakdown of the five clusters

This adjustment split the consulting group into two:
- Cluster 2: Professionals with early-stage (1-10 years) dense experience in Data and Analytics.
- Cluster 3: Those with mid-to-late stage transitions (6-15 years) from consulting to CxO roles.
Cluster 3 is seen as a model of a successful transition to corporate CxO from the consulting leadership.
Conclusion
Uncovering patterns in career progressions requires significant data transformation and preparation. The effort lies not in the coding itself but in structuring the data for meaningful analysis. This case study highlights the value of domain knowledge and thorough data preparation in workforce analytics.
The more deeply you understand your organization’s talent and data sources, the more effectively you can reveal insights that drive strategic decision-making. By leveraging these findings, organizations can better nurture leadership potential and optimize talent management strategies.